RF pollution and monitoring
Summary
"RF pollution" What is it and how can i measure itQuestion
What is meant by RF-pollution and how can i monitor it in my environmentCustomer Environment
Standard WI-FI enterprise network consisting of Ruckus Zone-Director WLC and AP running 9.8 firmware.Resolution
RF Pollution measures the level of RF contention and interference AP's experience due to wifi and non-wifi devices.
We can only show a value for RF Pollution (and capacity, for that matter) after the AP sends sufficient downlink traffic to provide an estimate (if the AP does not try to use the channel, we don’t know how congested it might be).
We prefer to use this RF Pollution terminology as PHY errors and CRC errors can be very misleading metrics because there is no standard way for the chipset to report them. Different chipsets can report these errors in different ways and certain types of noise can even mask these errors entirely. RF pollution is a more stable metric that will never produce misleading results.
in most normal environments the RF Pollution index will average between 10 and 100. Higher values are indicative of a noisier environment.
As a rough estimation.
10 = Definitely Good
100 =Not unexpected in 2.4, potentially suspicious in 5GHz
500 =Definitely Bad
How do we Monitor
As a rough estimation.
10 = Definitely Good
100 =Not unexpected in 2.4, potentially suspicious in 5GHz
500 =Definitely Bad
How do we Monitor
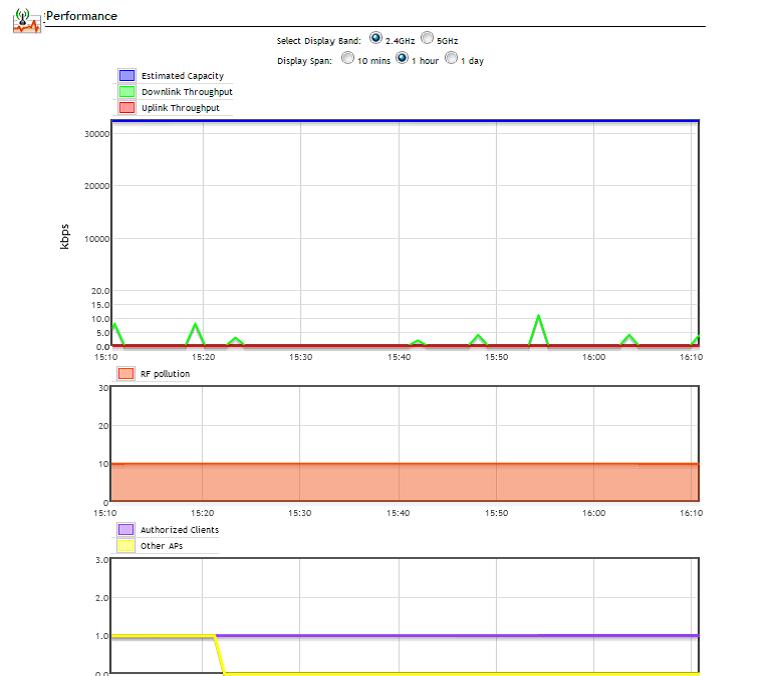
The Zone Director displays a graphical view of AP performance and RF environment statistics this can be seen on the Monitor>Access Points GUI page.
Three Performance analysis graphs plot the capacity, throughput, associated clients and RF contention in the channel as a function of time.
Limitations: (1) The capacity curve is updated only when the AP transmits more than 1000 packets, each containing at least 1024 bytes of data, within a one-minute measurement interval.
Limitations (2) The Other APs curve counts managed APs plus unmanaged BSSIDs, many of which may emanate from the same unmanaged AP.
The RF Pollution graph plots a proprietary metric describing the impediment due to other RF signals competing for use of the channel over time.
You can refer to the RF Pollution display as a measure of channel congestion. to periods of poor performance to see whether RF congestion is the problem.
You can also observe whether dips in throughput correspond to wireless channel congestion versus factors unrelated to wireless performance, such as a slow server or heavily loaded laptop.
You can also observe whether dips in throughput correspond to wireless channel congestion versus factors unrelated to wireless performance, such as a slow server or heavily loaded laptop.
Article Number:
000001655
Updated:
May 06, 2020 04:38 PM (over 5 years ago)
Tags:
Performance, ZoneDirector
Votes:
8
This article is:
helpful
not helpful